Types of Plastics

| Recycling Resources Plastic Recycling Recycling Facts Green Living |
In an attempt to bring order to plastics classification for recycling purposes, the Society of the Plastics Industry (SPI) devised some voluntary codes in 1988.
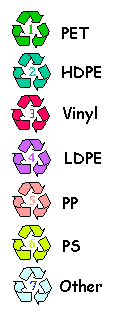
These codes (numbered recycling arrows), commonly called SPI codes, get stamped or labeled on most plastic products. The numbers within the recycling arrows refer to different types of plastic resins.
The addition of corn based plastic, PLA, into the plastic bottle and wrapping industries represents the only significant update to plastics typing over the past twenty years.
Absent federal plastic labeling regulations, a bit of inconsistent labeling might be expected industry wide. As a general rule of thumb, use of SPI codes across the plastic industry remains a fairly standard practice.
A brief description of each SPI plastic type follows.

|
- PET (polyethylene terephthalate): plastic soft drink bottles, water bottles, beer bottles, mouthwash bottles and many more
- HDPE (high density polyethylene): milk bottles, detergent bottles, oil bottles, toys, plastic bags
- PVC (polyvinyl chloride): food wrap, vegetable oil bottles, blister packaging
- LDPE (low density polyethylene): bread bags, frozen food bags, squeezable bottles, fiber, tote bags, bottles, clothing, furniture, carpet, shrink-wrap, garment bags
- PP (polypropylene): margarine and yogurt containers, caps for containers, wrapping to replace cellophane
- PS (polystyrene): egg cartons, fast food trays, disposable plastic silverware
- Other: This code indicates that the item is made with a resin other than the six listed above, or a combination of different resins.
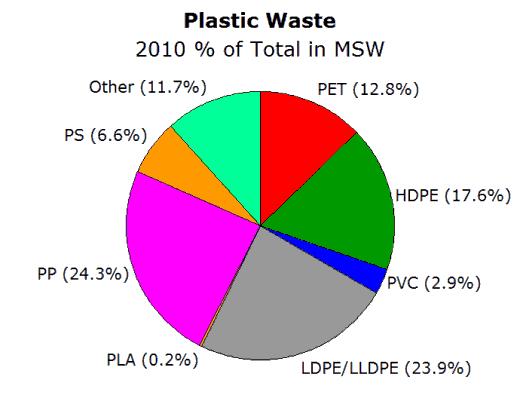
The pie chart at the top of the page compares the amount of the different plastic types in the 2010 municipal waste stream. The common beverage container plastics, PET and HDPE, compose approximately 30% of the 2010 plastic waste stream. Packaging materials, primarily the low density polyethylene materials compose another 23.9% of the waste stream.
Taken together, the statistics tell us that plastic beverage containers and plastic food packaging make up over fifty percent of the total plastic waste stream.
The recent addition of PLA plastic waste statistics provides one additional chart note. Currently PLA constitutes .2% of the entire plastic waste stream.
Total PLA waste may or may not be sufficient to contaminate already established plastic recycling waste streams. Apart from that issue, the small amount of current PLA production provides little insight into potential long term PLA production trends.
Plastic recycling discussions get a bit more detailed about the types of plastics in the waste and recovery streams.
The statistics presented in the plastic recycling article follow the industry standard three category organizing framework, which distinguishes between durable, nondurable and container plastic types.
